The window, decoded.
Millwall analytics, measured rather than argued. Event data from 684 matches, a Championship-native xG model, and the honest version of what this squad is before a ball is kicked.
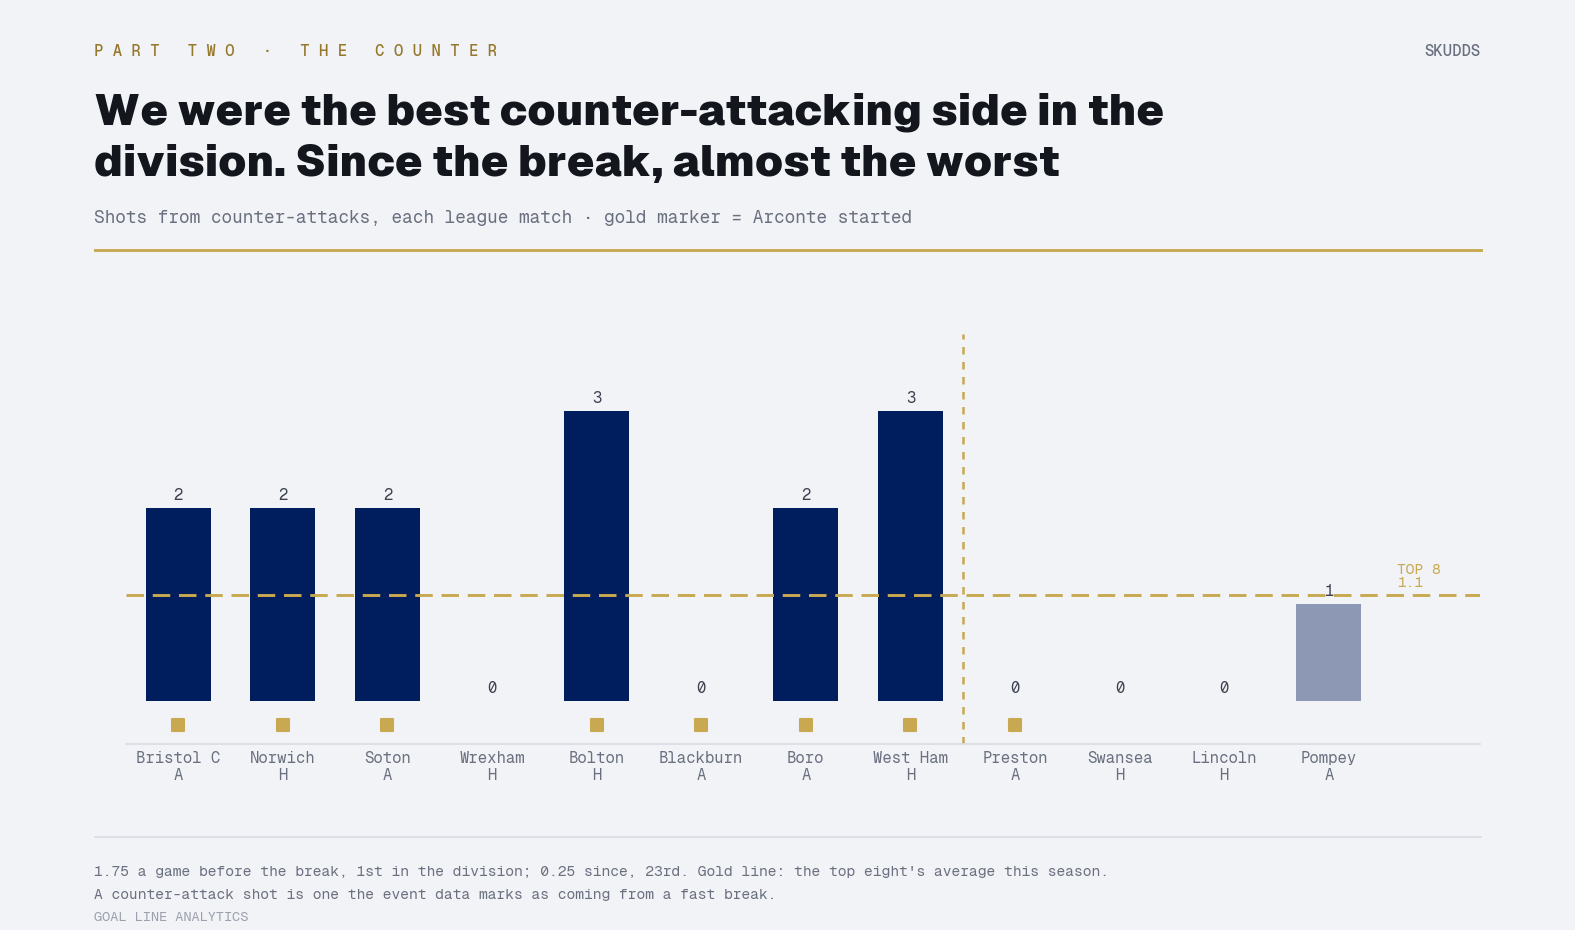
The counter-attack we lost.What has gone missing at the other end.
Before the break we were the best counter-attacking side in the Championship. Since, one counter-attack shot in four games. We are scoring what our chances are worth. We are just making far fewer of them.
30 OCT 2026 · Read the full accounting →Four findings from the closed window
Millwall’s summer, measured
The full accounting of the closed window: twelve arrivals profiled, the deadline-day sale that turned the cycle again, and where twenty thousand simulated seasons put this squad.
Read →96thCrocombe's stopping, same scaleThe keeper question, answered in the final hours
Filip Marschall shared League One's Golden Glove, but the card says the honest thing: league-average stopping behind the league's second-best protection. The sobering line is Crocombe's, at the 96th percentile on the same scale.
Read →3Clubs down from the PLWho actually stands in the way
Every club that finished above Millwall has left the division. Three come down from the Premier League, only one of them intact, and Southampton start on minus four.
Read →6thMedian finish · 71 ptsWhere this squad should finish
A goals model, fitted on completed results and simulated match by match. Millwall took 82 points last season from goals worth 74, and this one does not carry that forward.
Read →Where twenty thousand simulated seasons land.
Ordered by median points, but the bands are what matter. The clubs at the top are separated by three or four points across ranges that almost entirely overlap, which is a cluster rather than a running order. The right-hand column is the number that decides anything: how often each club finishes in the top six.